Full domain summary statistics of model performance#
Taylor diagrams for the sea surface
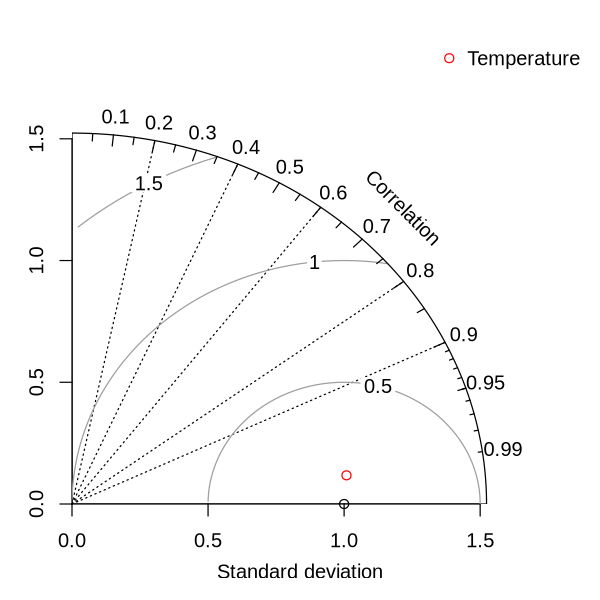
Figure 1: Taylor diagram for sea surface annual mean of Temperature. This diagram compares climatological annual averages of the model and observations across the model’s spatial domain. Standard devaiation is normalized by the standard deviation of the observations, and a standard deviation below 1 indicates that the model is less variable than the observations. Note: This figure summarizes the overall ability of the model to reproduce climatological spatial patterns, and it does not represent temporal performance.
Model biases based on gridded sea surface data
| Variable | Model mean | Observed mean | Model bias | Percentage bias |
|---|---|---|---|---|
| Temperature | 19.15 | 18.49 | 0.66 | N/A |
Table 1: Bias of model compared with sea surface observations. The bias is calculated as the modelled spatial mean minus the observational spatial mean. The percentage bias is calculated as the model bias divided by the observational spatial mean.
Spatial performance of the model at the sea surface
| Variable | Spatial correlation between model and observations | Spatial RMSD between model and observations |
|---|---|---|
| Temperature | 0.99 | 1.51 |
Table 2: Pearson correlation coefficient and RMSD between model and observations at the sea surface for annual mean of sea temperature. This table compares climatological annual averages of the model and observations across the model’s spatial domain.
Temporal performance of the model at the sea surface
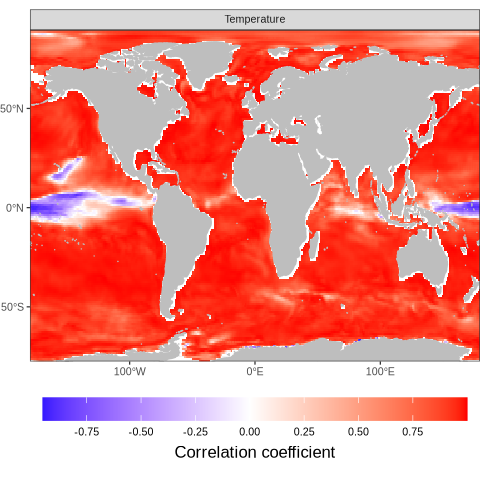
Figure 2: Spatial correlation (Pearson correlation coefficient) between model and observations for annual mean of sea temperature. This figure compares climatological monthly averages of the model and observations across the model’s spatial domain.
The overall ability of the model reproduce the seasonality of each variable was estimated by calculating the spatial mean of the Pearson correlation coefficient between the model and the observations. The spatial mean was calculated by averaging the correlation coefficient of each grid cell.
| Variable | r |
|---|---|
| Temperature | 0.84 |
Table 3: Spatial average of the temporal correlation (Pearson correlation coefficient) between model and observations for annual mean of sea temperature. The correlation is calculated for each grid cell individually using monthly climatological averages. The spatial average is then calculated for each variable.