Built-in methods for handling files with multiple vertical levels — fixed z-levels or terrain-following coordinates alike.
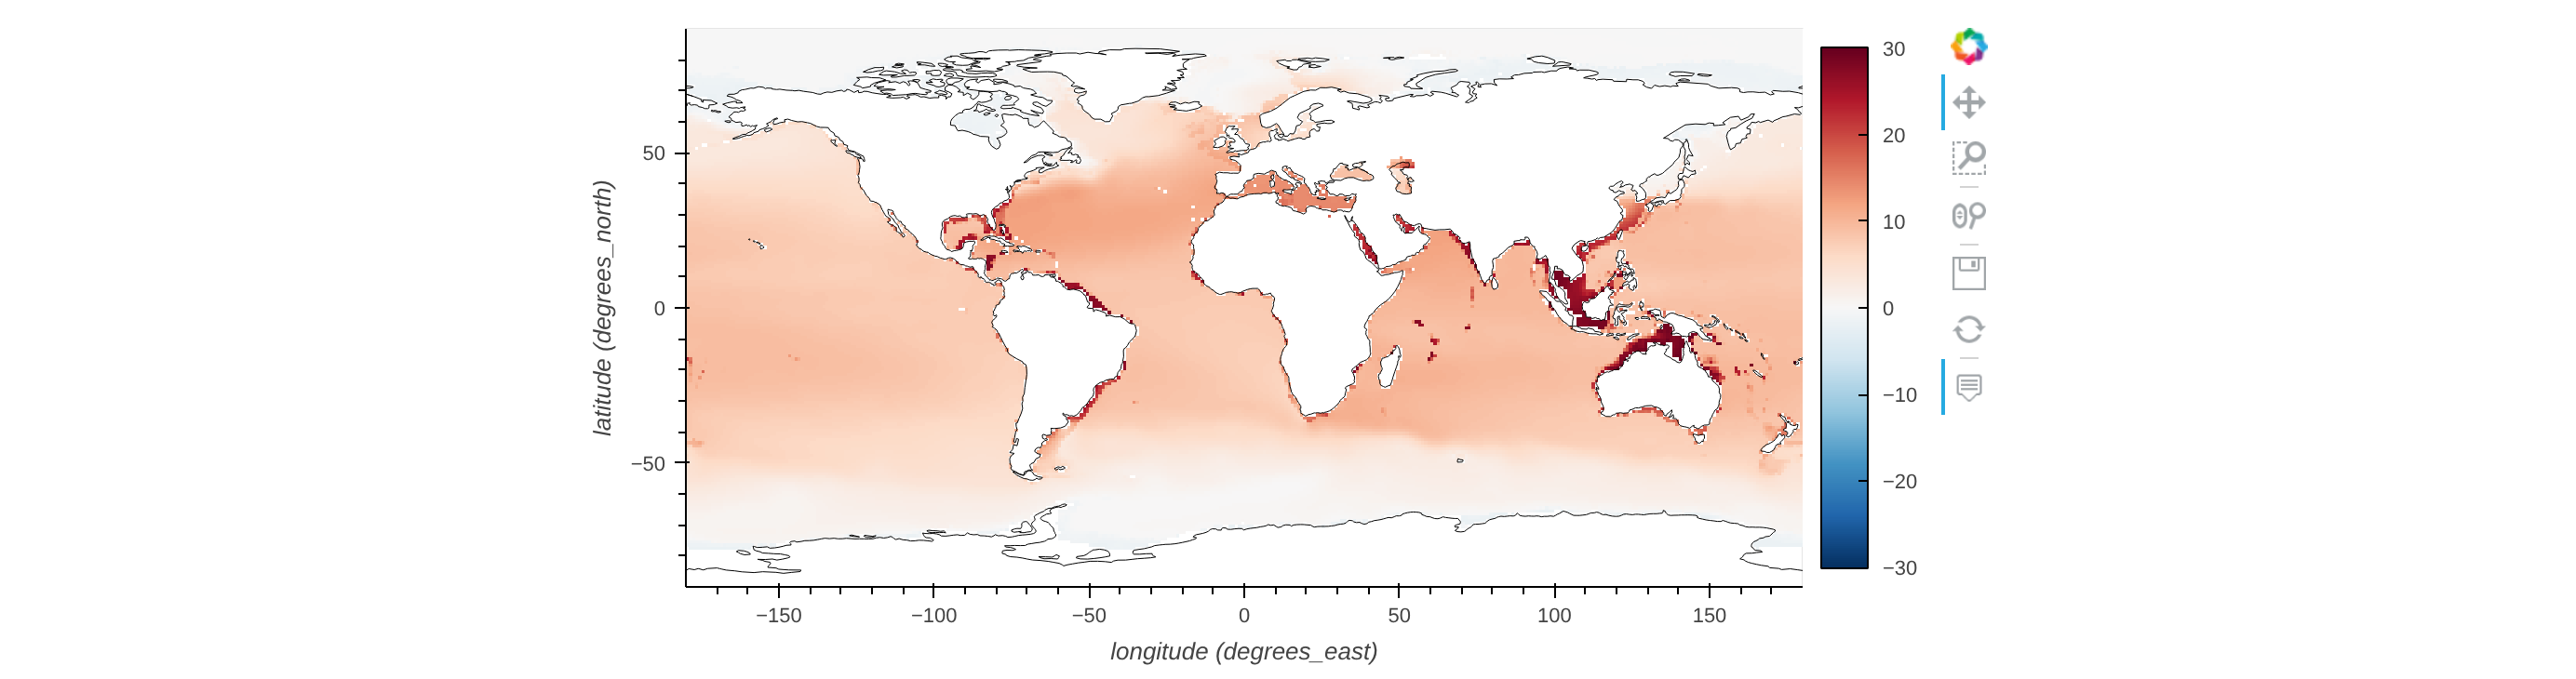
Illustrated below using depth-resolved ocean temperature from NOAA's World Ocean Atlas for January, down to 1500 metres across 57 vertical levels.
Vertical means account for cell thickness where it's available — you must specify fixed, telling NCToolkit whether the vertical levels are consistent across space:
ds = nc.open_thredds("https://www.ncei.noaa.gov/thredds/dodsC/ncei/woa/temperature/decav/1.00/woa18_decav_t00_01.nc")
ds.vertical_mean(fixed=True)
ds.plot()
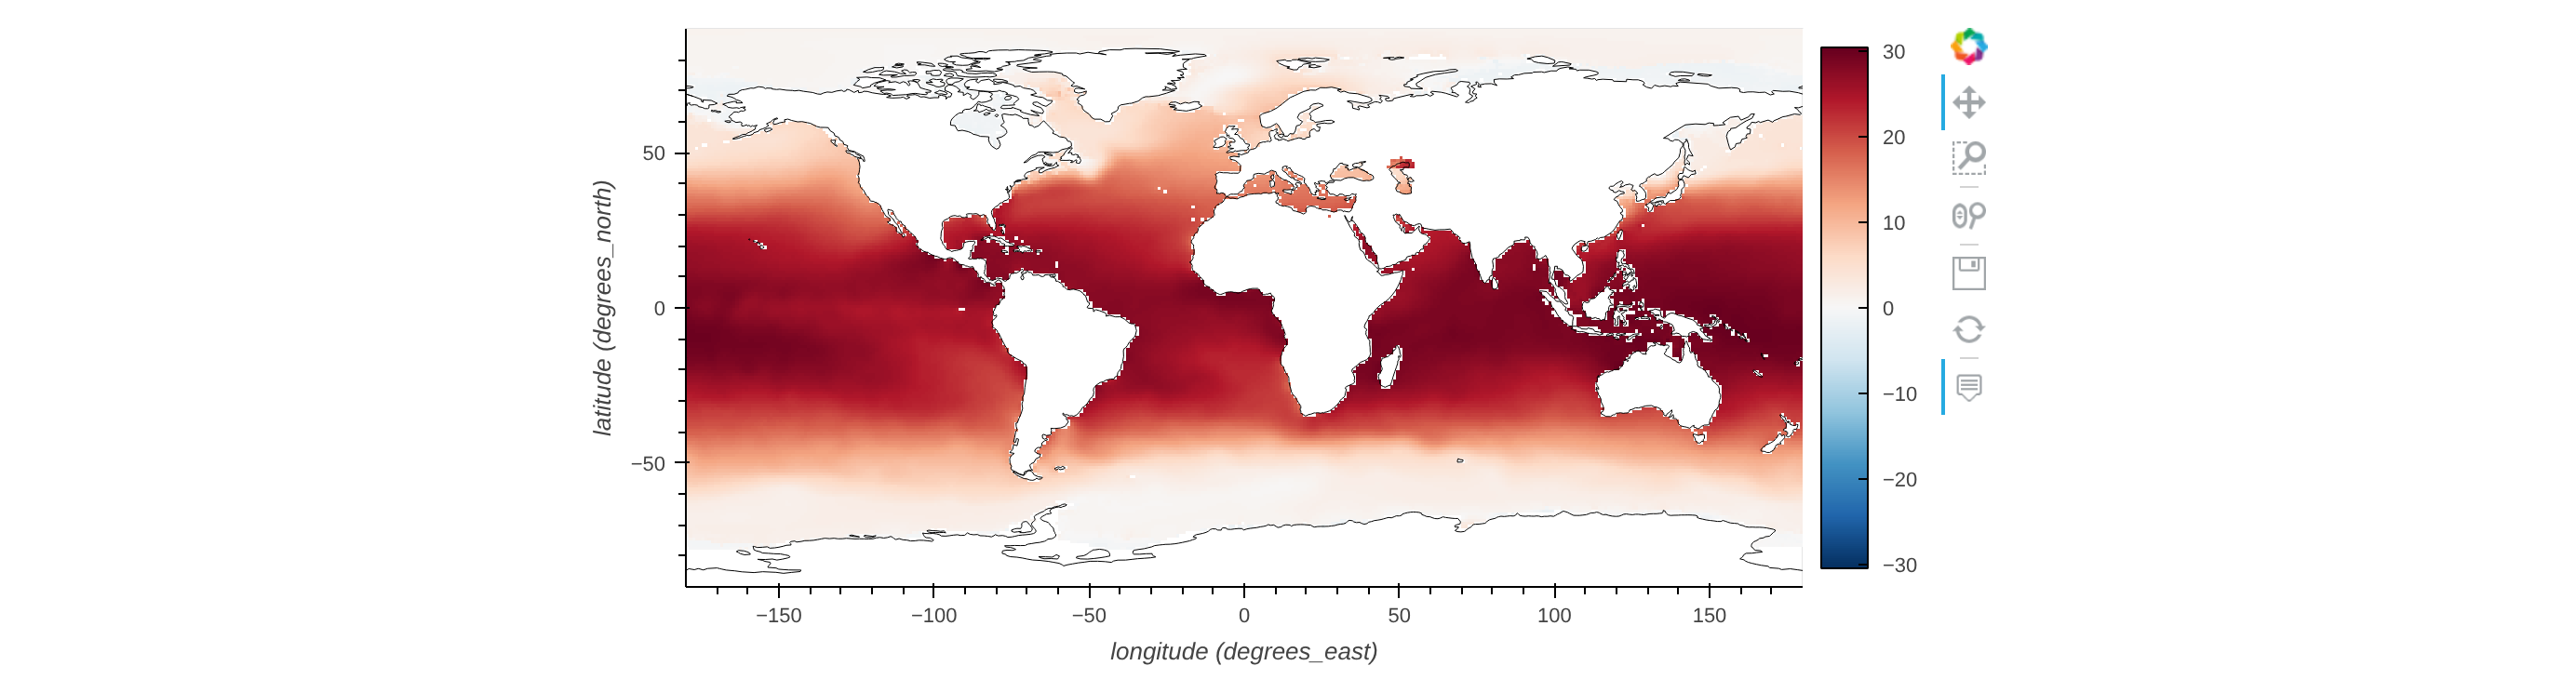
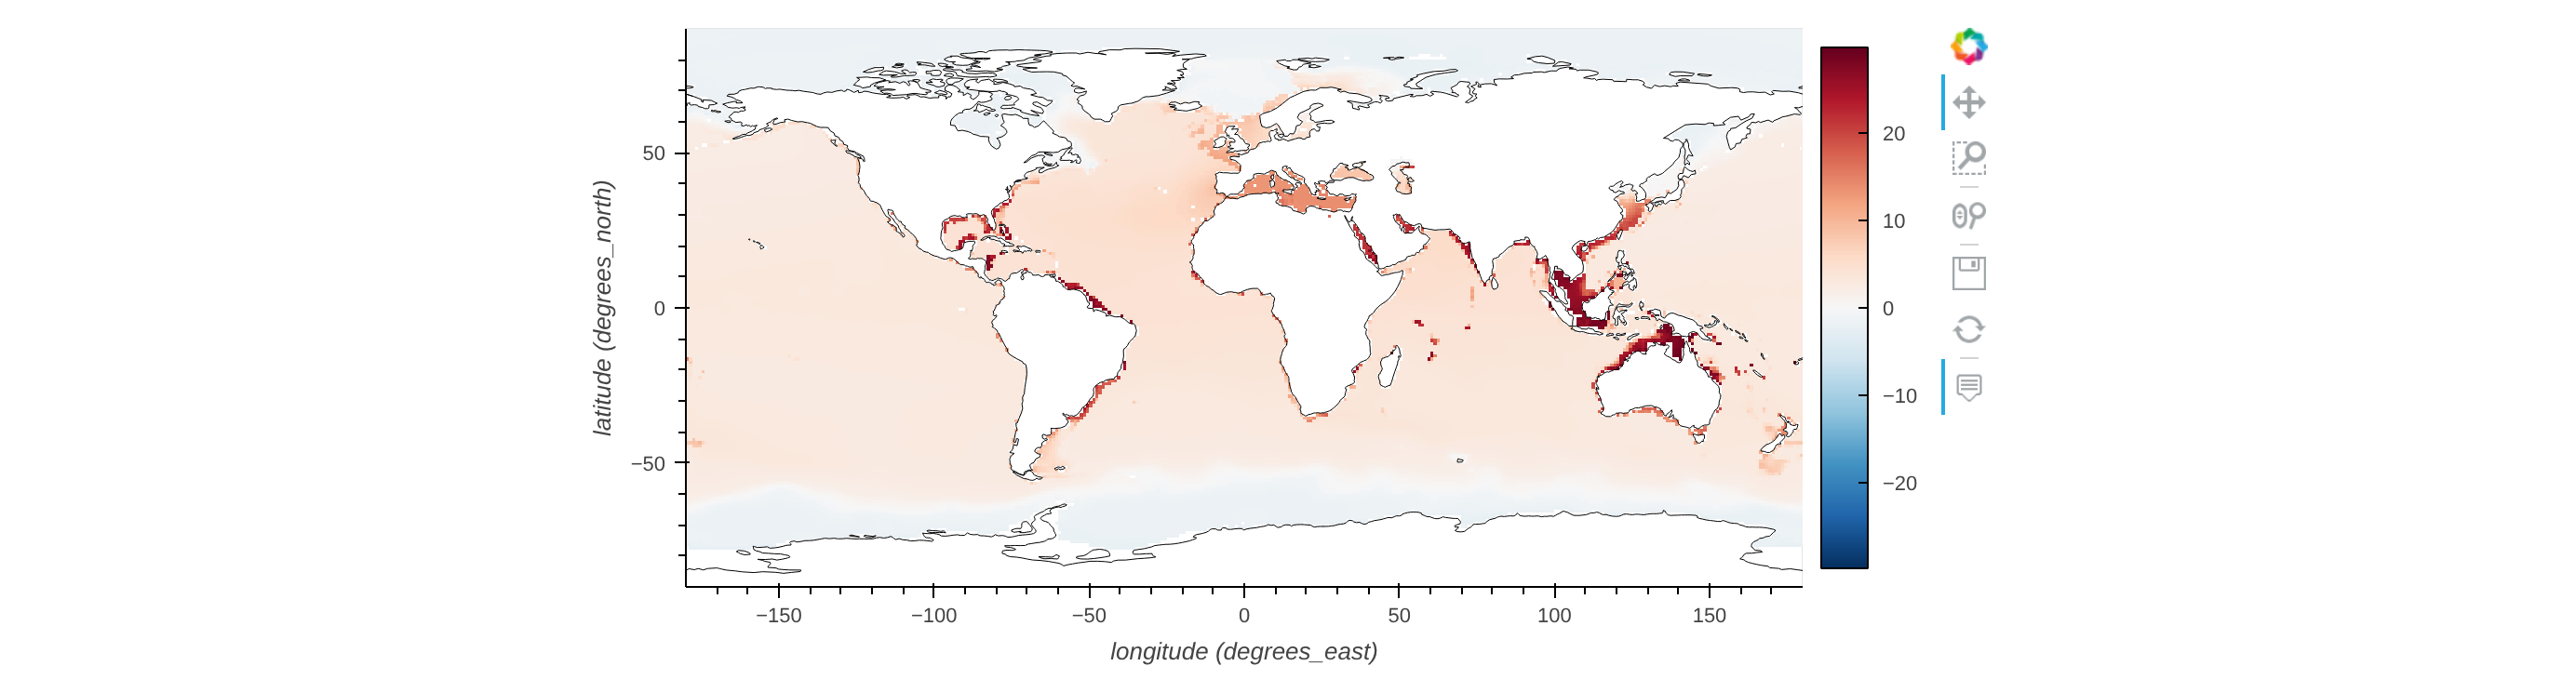
vertical_max and vertical_min work the same way:
ds = nc.open_thredds("https://www.ncei.noaa.gov/thredds/dodsC/ncei/woa/temperature/decav/1.00/woa18_decav_t00_01.nc")
ds.vertical_max()
ds.plot()
ds = nc.open_thredds("https://www.ncei.noaa.gov/thredds/dodsC/ncei/woa/temperature/decav/1.00/woa18_decav_t00_01.nc")
ds.vertical_min()
ds.plot()
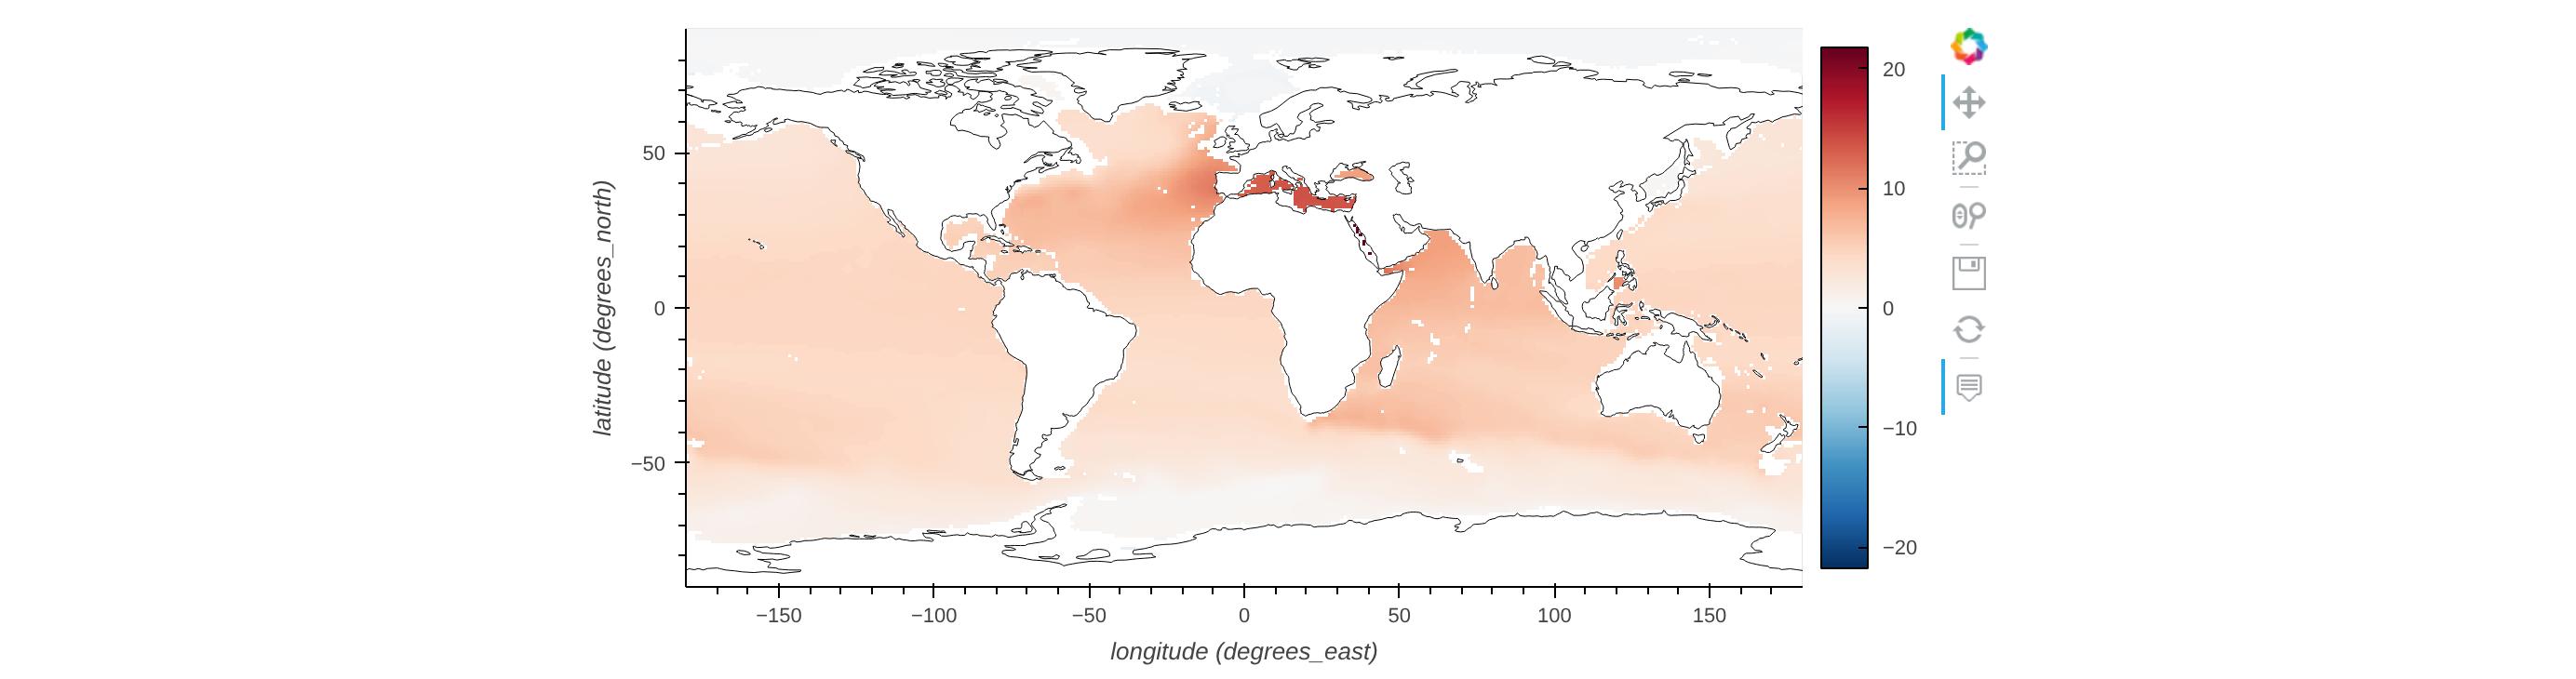
vertical_interp interpolates to specific target levels — here, to a single depth of 1000m:
ds = nc.open_thredds("https://www.ncei.noaa.gov/thredds/dodsC/ncei/woa/temperature/decav/1.00/woa18_decav_t00_01.nc")
ds.subset(timestep=0)
ds.vertical_interp(levels=[1000], fixed=True)
ds.plot()
Select the surface vertical level directly with top:
ds = nc.open_thredds("https://www.ncei.noaa.gov/thredds/dodsC/ncei/woa/temperature/decav/1.00/woa18_decav_t00_01.nc")
ds.top()       # select the sea-surface
ds.plot()
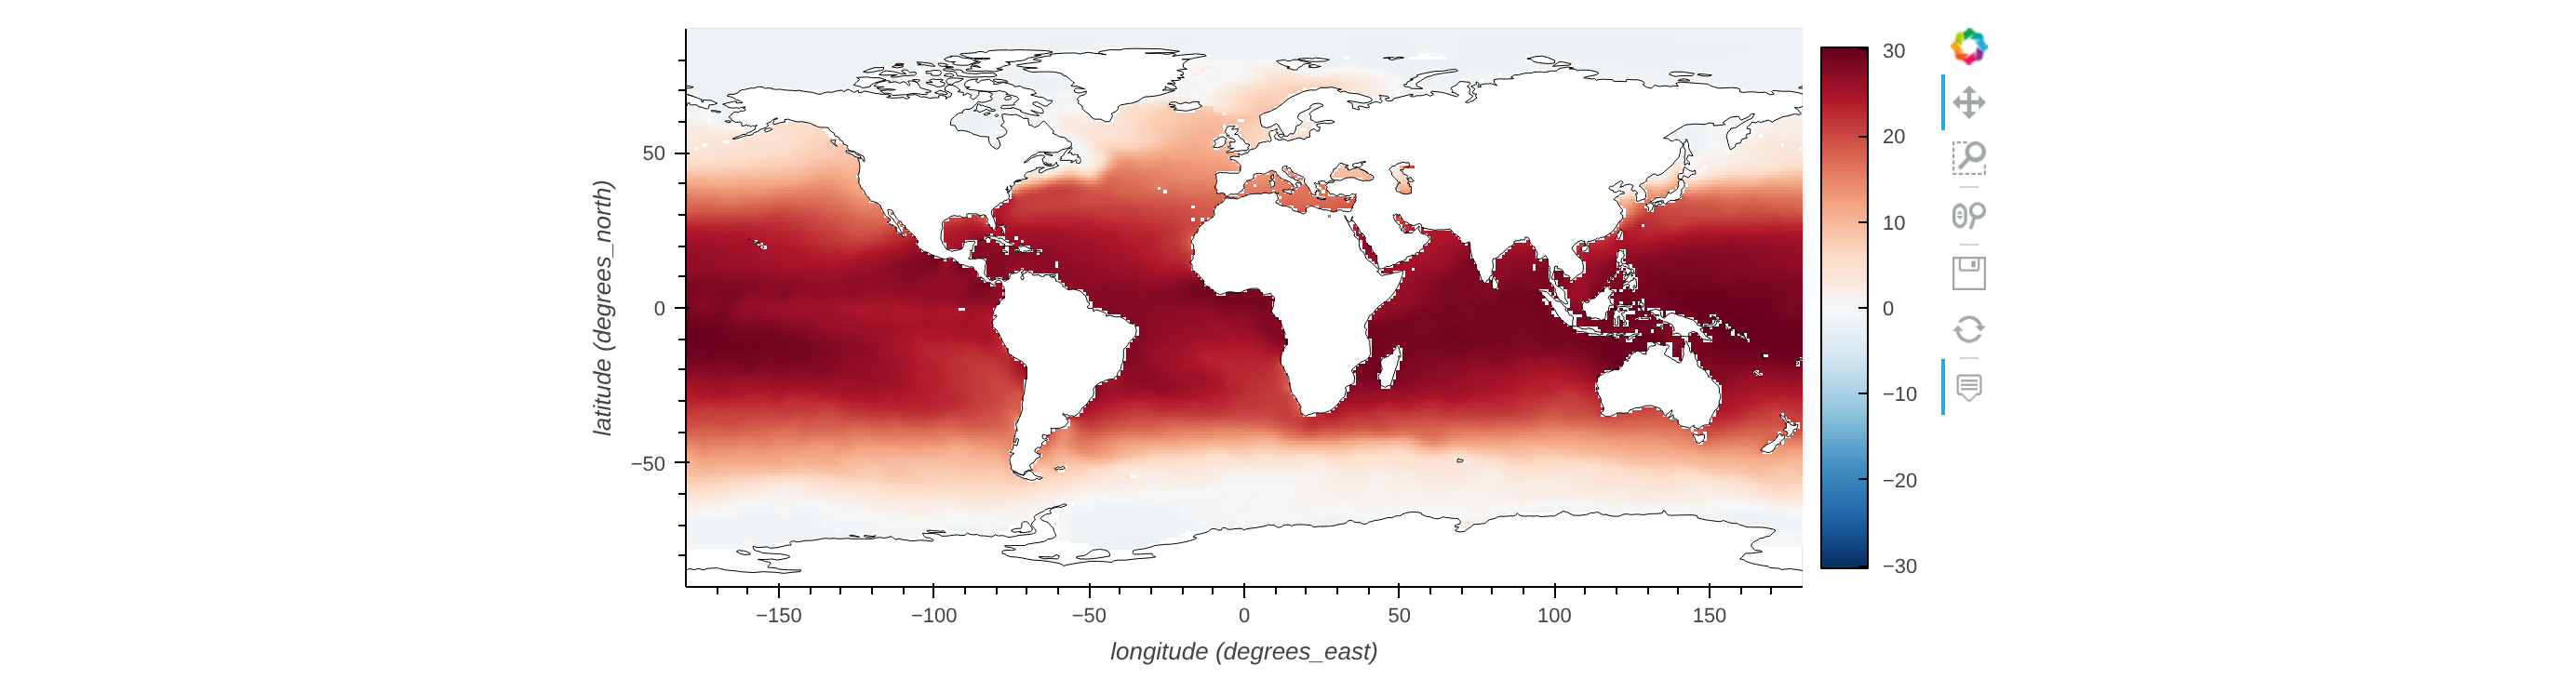
bottom works the same way, selecting the sea-floor level instead:
ds = nc.open_thredds("https://www.ncei.noaa.gov/thredds/dodsC/ncei/woa/temperature/decav/1.00/woa18_decav_t00_01.nc")
ds.bottom()    # select the sea-floor
For quick reference, every vertical method NCToolkit provides:
| Method | Description |
|---|---|
ds.top() | Extract the top/surface level. |
ds.bottom(...) | Extract the bottom (deepest valid) level. |
ds.vertical_interp(...) | Interpolate to specific target vertical levels. |
ds.vertical_mean(...) | Depth-averaged mean, accounting for cell thickness where available. |
ds.vertical_min() | Vertical minimum at each grid cell and time step. |
ds.vertical_max() | Vertical maximum at each grid cell and time step. |
ds.vertical_range() | Vertical range (max − min) at each grid cell and time step. |
ds.vertical_sum() | Vertical sum at each grid cell and time step. |
ds.vertical_integration(...) | Vertically integrated total, accounting for cell thickness. |
ds.vertical_cumsum() | Cumulative sum with depth/height. |
ds.invert_levels() | Reverse the order of the vertical levels. |
ds.bottom_mask() | Mask identifying the deepest valid (non-missing) cell — e.g. the seabed. |