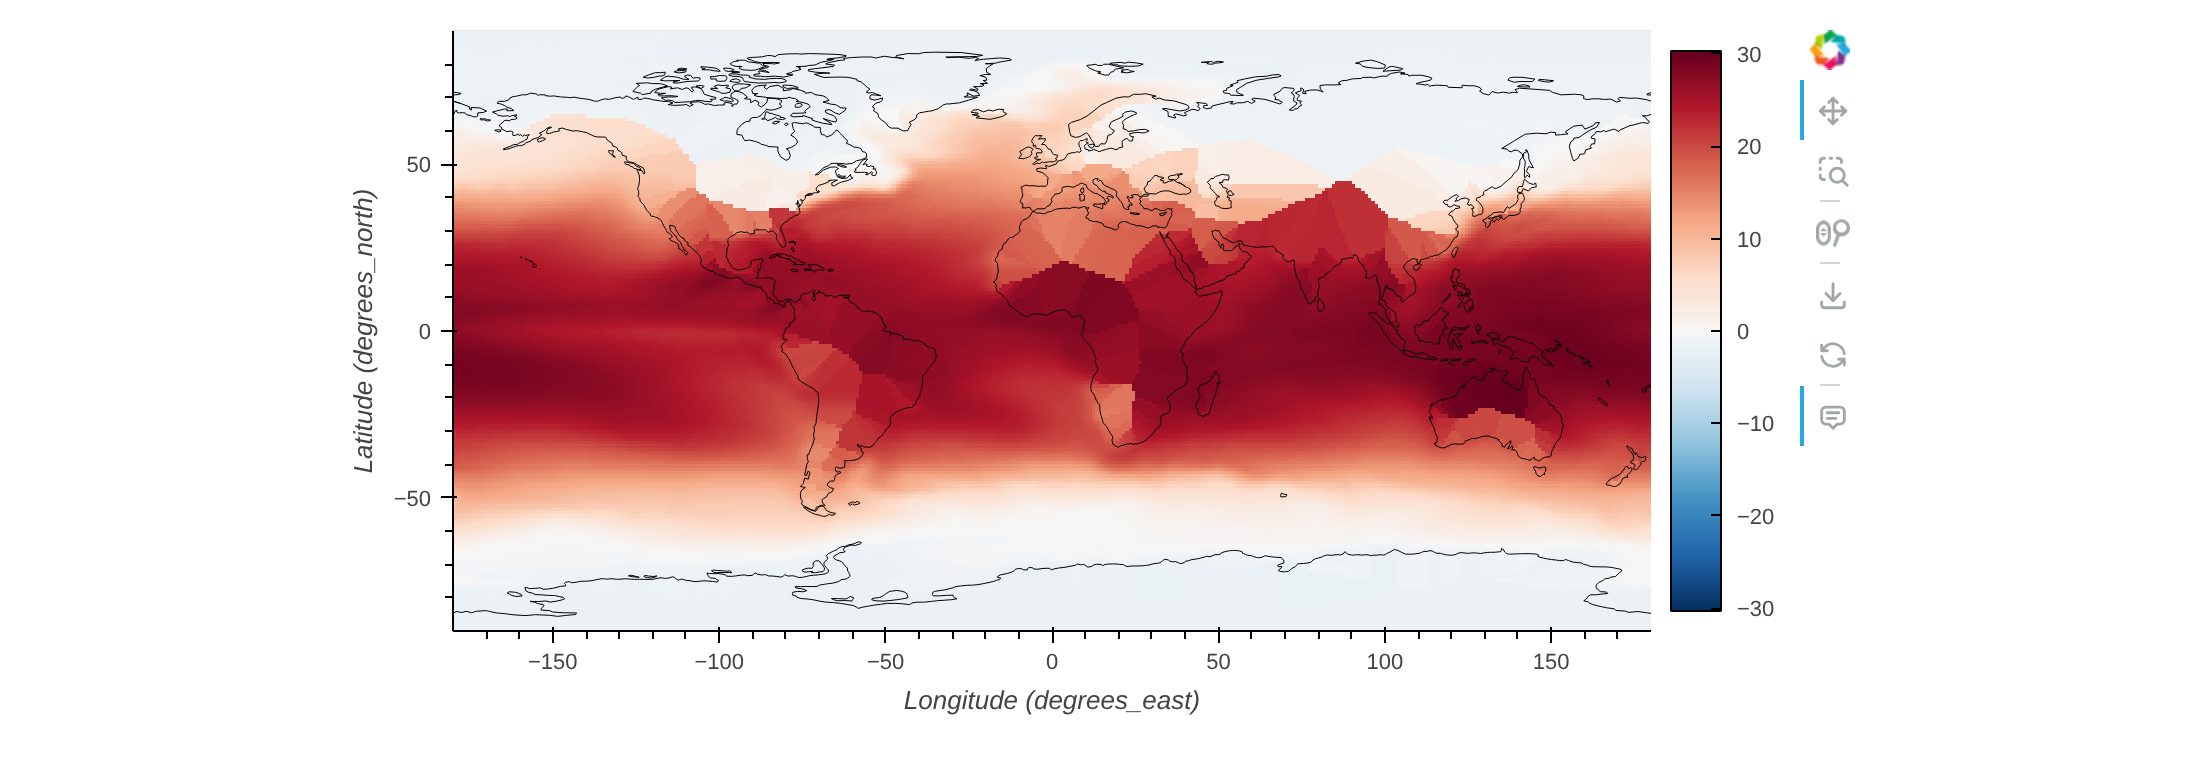
The examples below regrid global sea-surface temperature from NOAA's COBE-SST 2, using NCToolkit's built-in horizontal and vertical interpolation methods. We'll speed things up by only interpolating the first timestep of data.
ds = nc.open_thredds("https://psl.noaa.gov/thredds/dodsC/Datasets/COBE2/sst.mon.mean.nc")
ds.subset(time=0)
ds.plot()
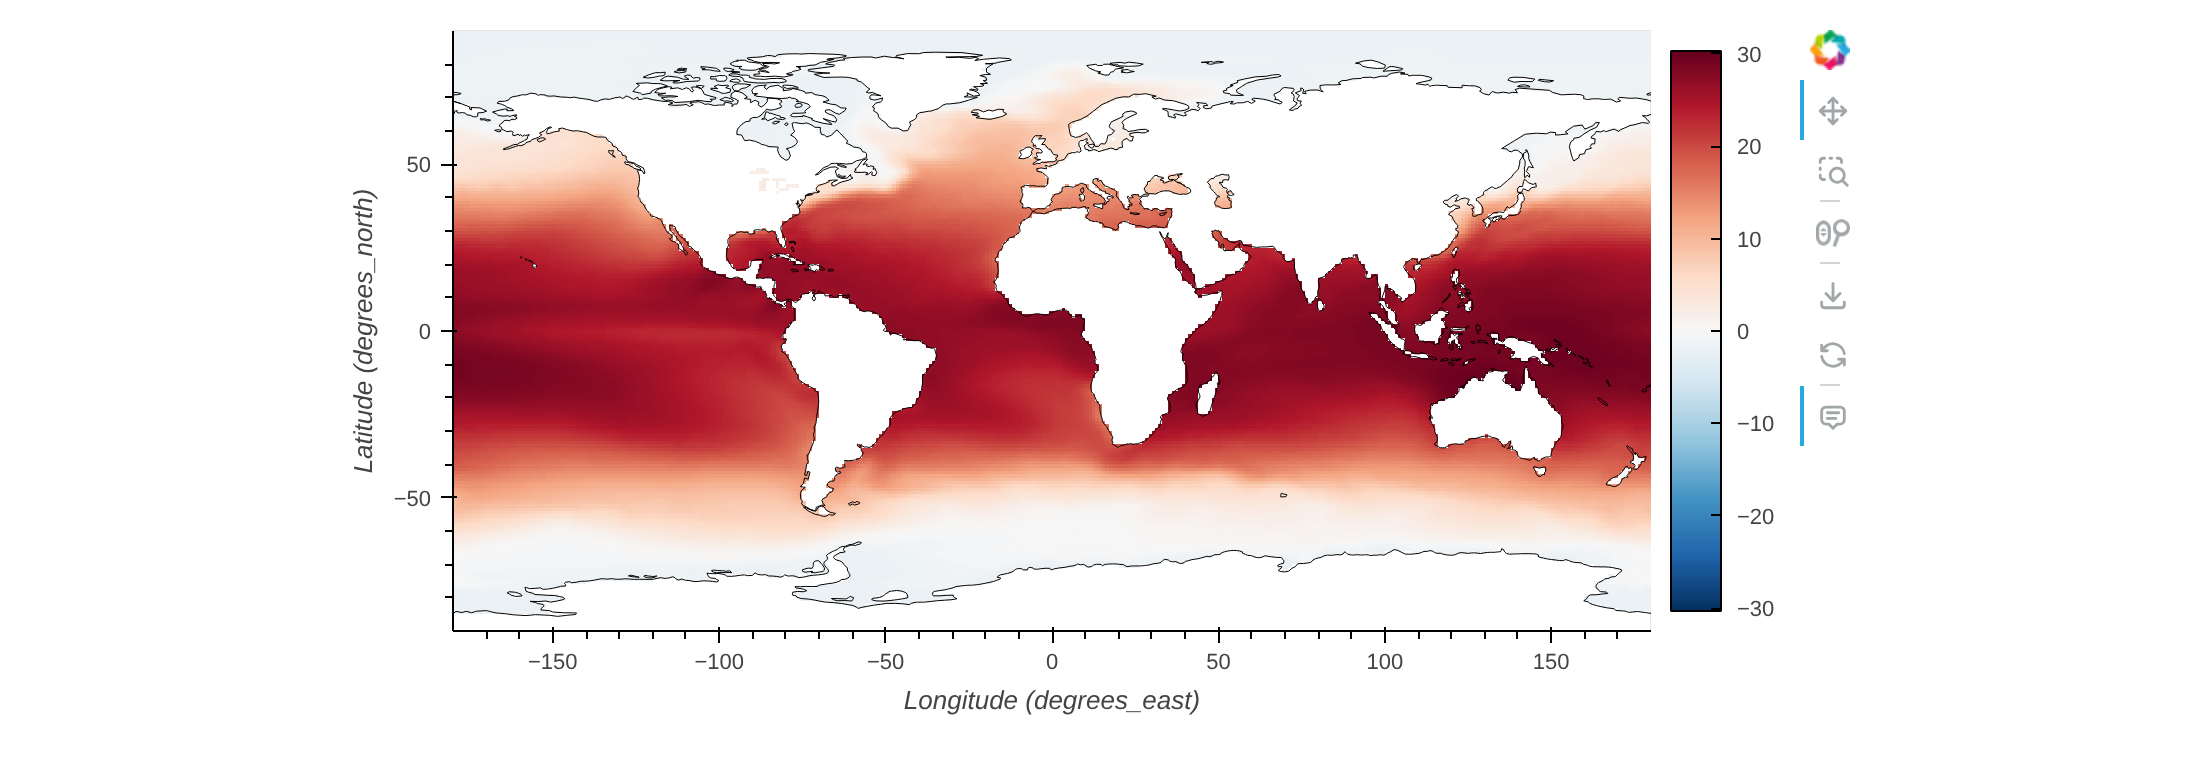
to_latlon regrids to a regular grid: give the extent (lon, lat) and resolution (res):
ds.to_latlon(lon=[-79.5, 79.5], lat=[0.75, 89.75], res=[1, 0.5])
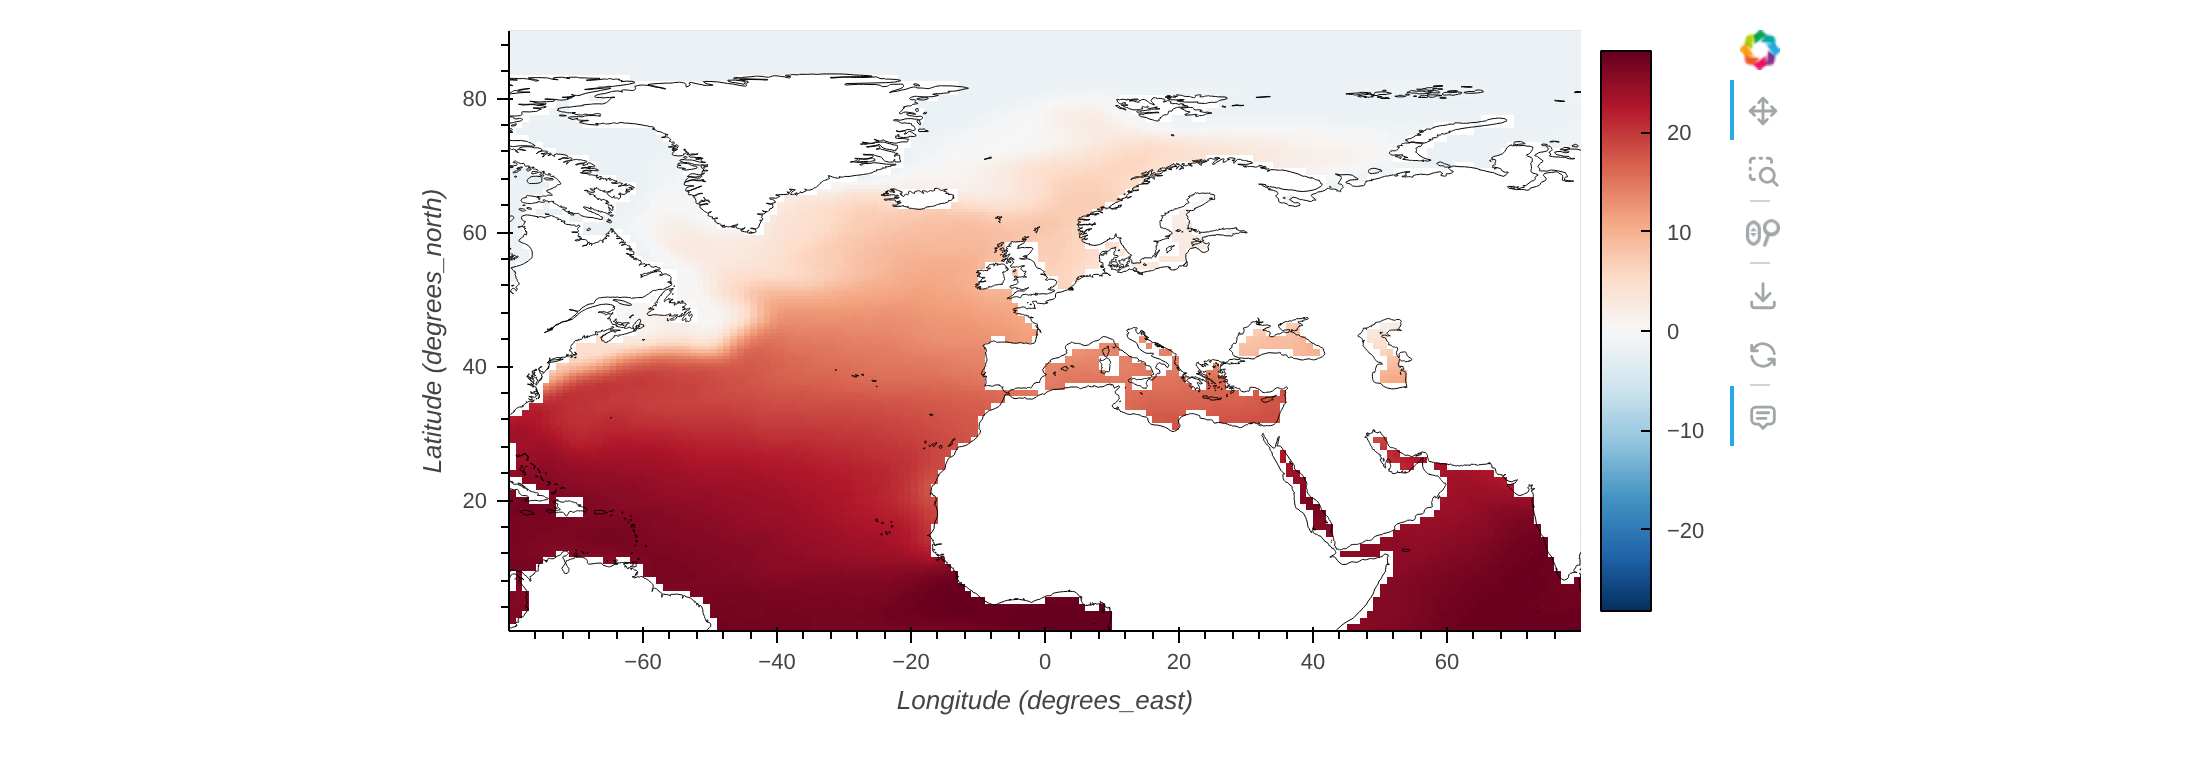
regrid interpolates a dataset onto the grid of another dataset (or a netCDF file used purely as a grid template). Here, we first crop one dataset to the northern hemisphere to use as the target grid:
ds1 = nc.open_thredds("https://psl.noaa.gov/thredds/dodsC/Datasets/COBE2/sst.mon.mean.nc")
ds1.subset(timestep=0)
ds1.subset(lat=[0, 90])
ds1.plot()
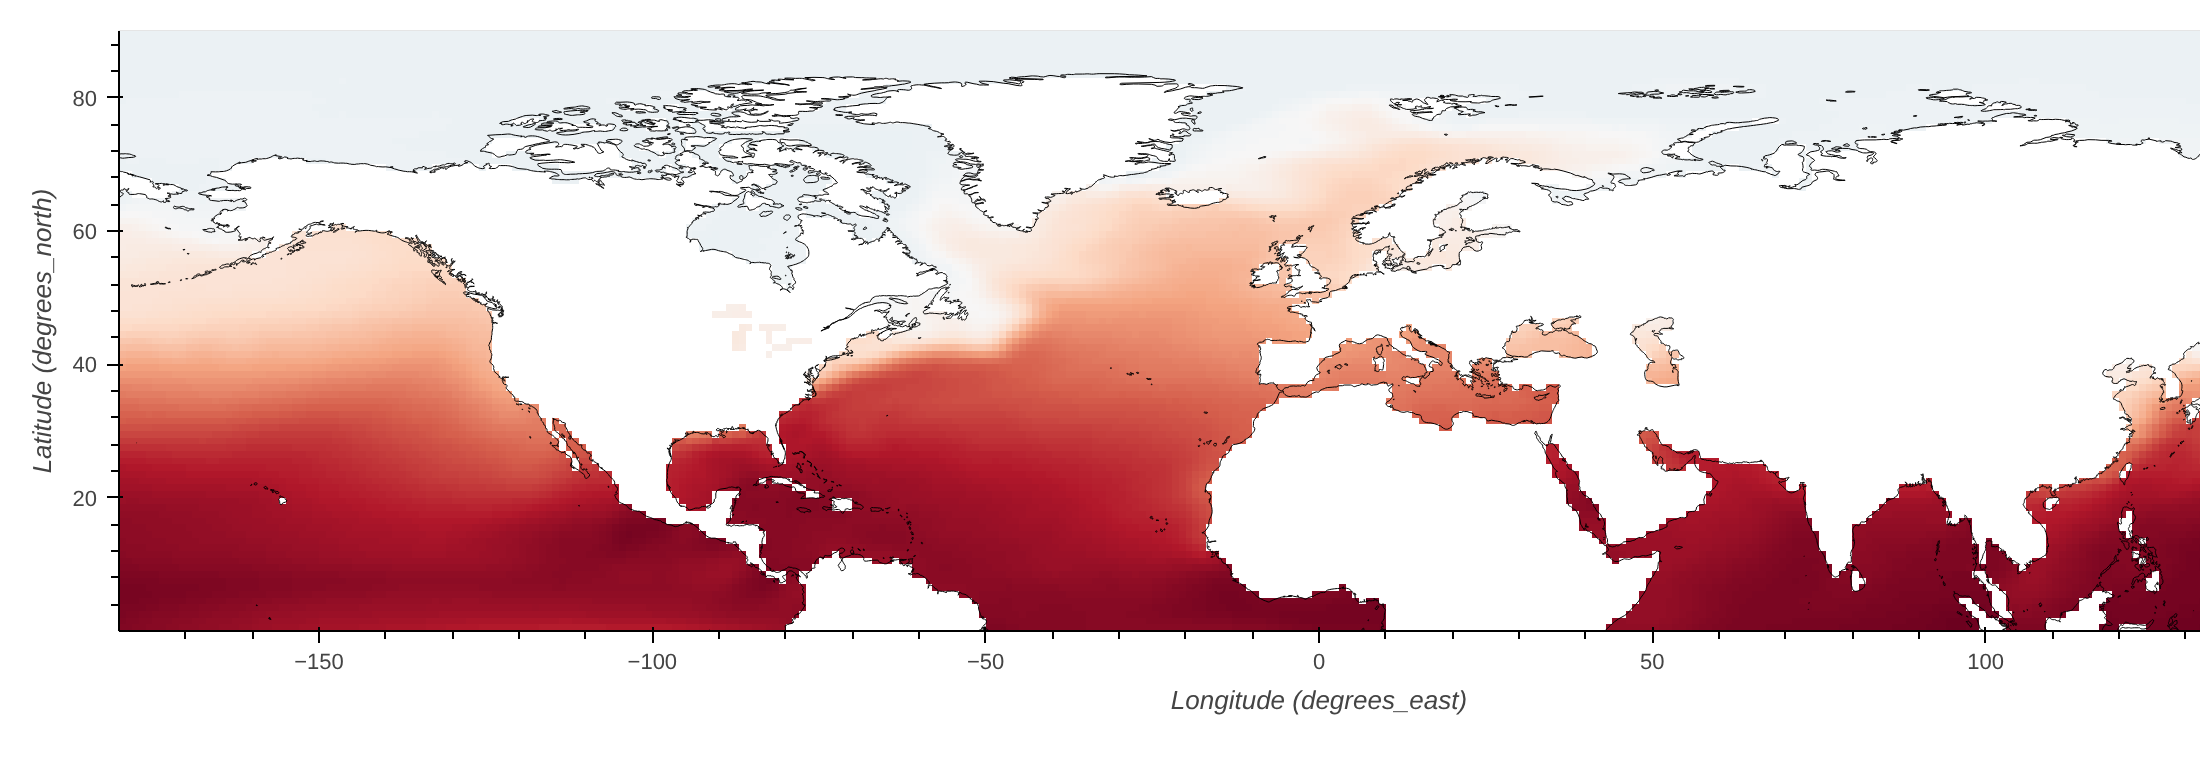
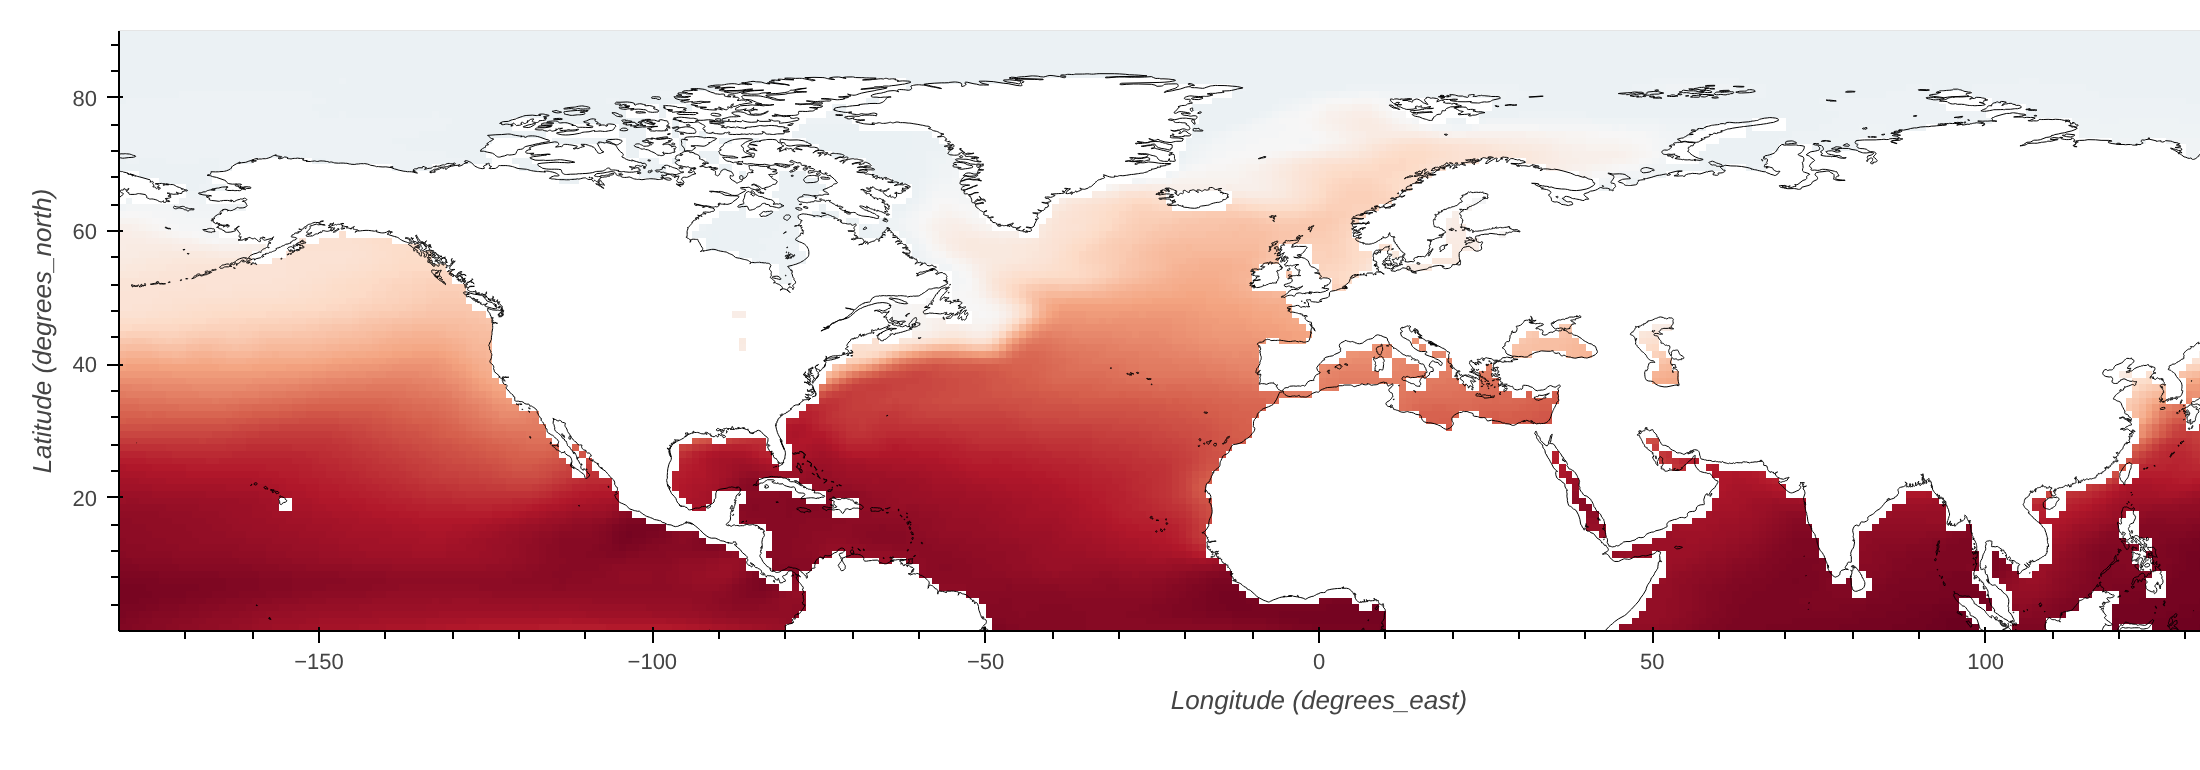
Now regrid the original file onto that northern-hemisphere grid — this also works with a plain netCDF file path as the target:
ds2 = nc.open_thredds("https://psl.noaa.gov/thredds/dodsC/Datasets/COBE2/sst.mon.mean.nc")
ds2.subset(timestep=0)
ds2.regrid(ds1)
ds2.plot()
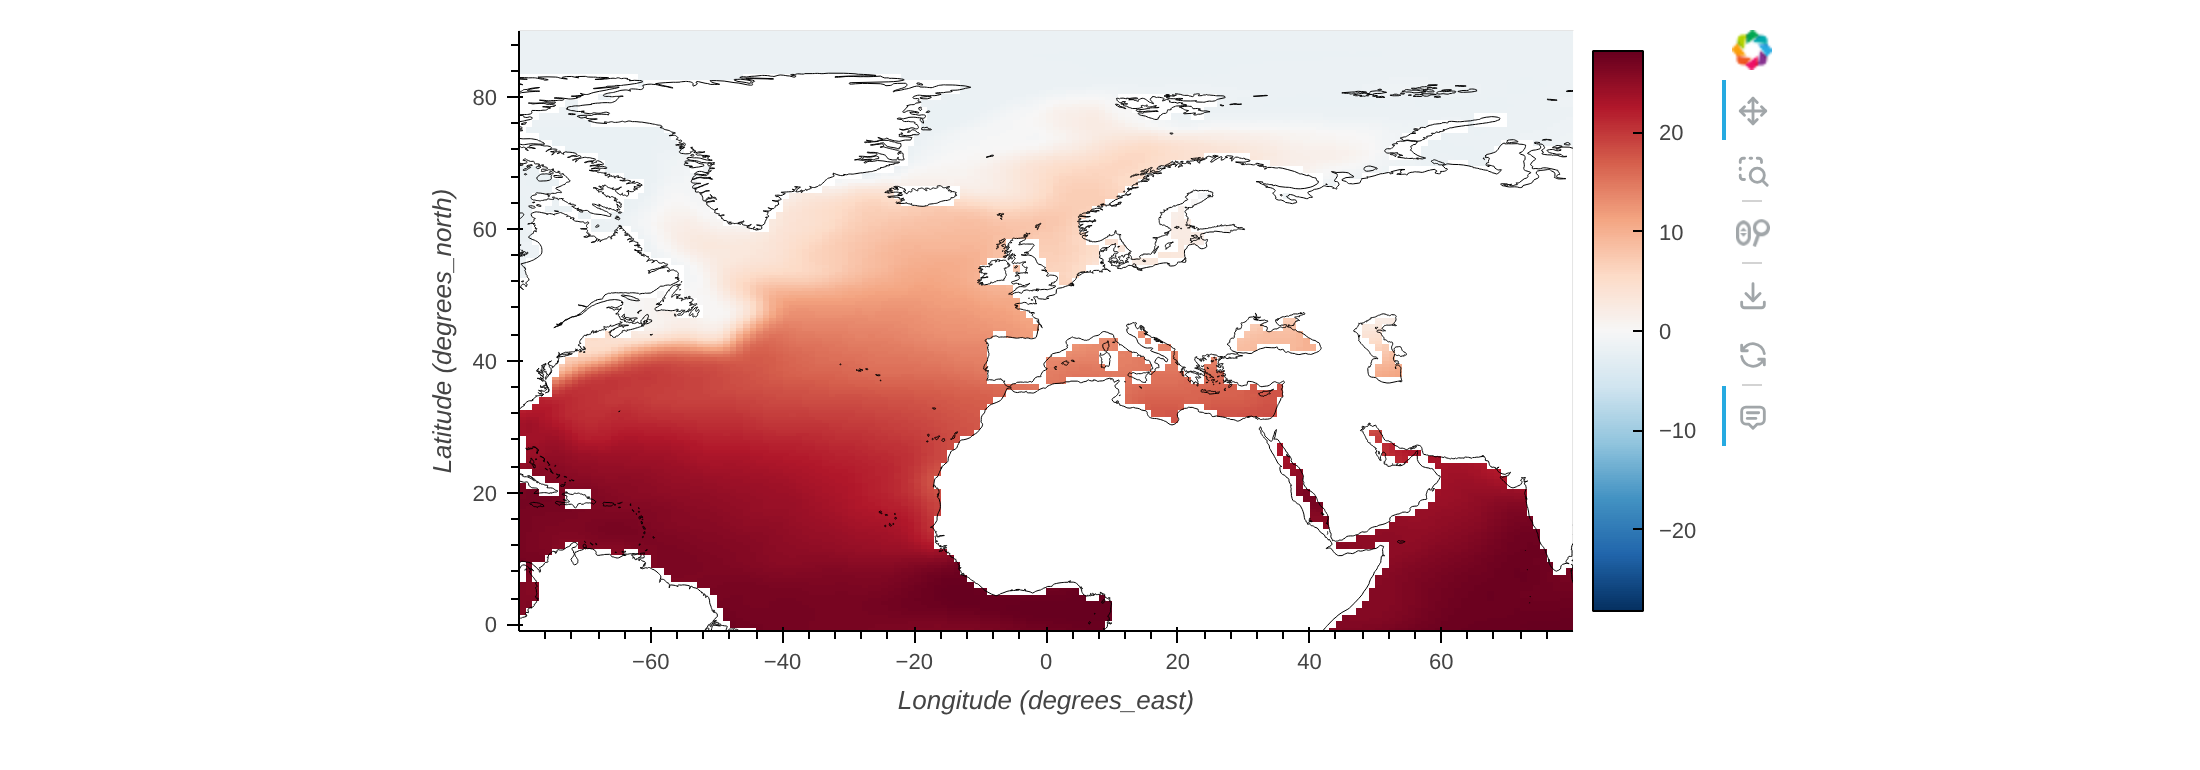
Regridding generates a weights file first. If you're regridding many files onto the same target grid one after another — postprocessing a batch of files, say — set recycle=True on the first call so regrid can reuse those weights on later calls:
ds = nc.open_thredds("https://psl.noaa.gov/thredds/dodsC/Datasets/COBE2/sst.mon.mean.nc")
ds.subset(timestep=0)
ds.to_latlon(lon=[-79.5, 79.5], lat=[-0.75, 89.75], res=[1, 0.5], recycle=True)
ds.plot()
ds1 = nc.open_thredds("https://psl.noaa.gov/thredds/dodsC/Datasets/COBE2/sst.mon.mean.nc")
ds1.subset(timestep=0)
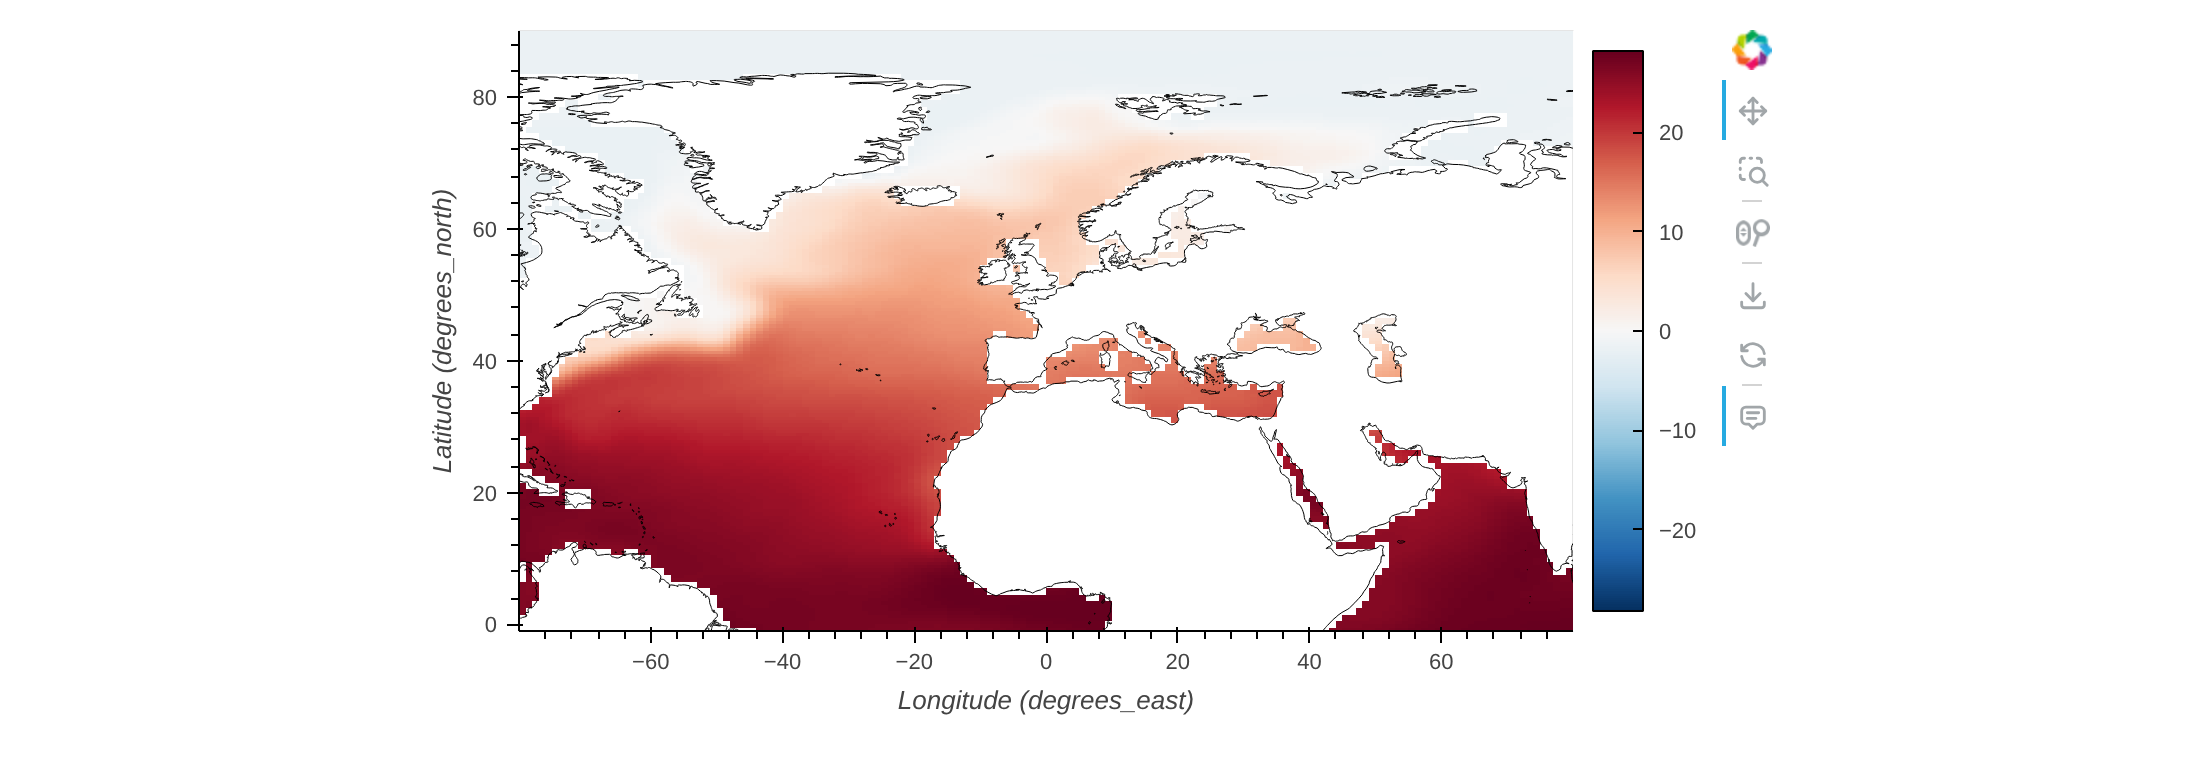
ds1.regrid(ds)   # reuses the weights generated above
ds1.plot()
regrid also accepts a pandas dataframe of lon/lat columns, to interpolate onto specific points:
coords = pd.DataFrame({"lon": [-30], "lat": [50]})
ds.regrid(coords)
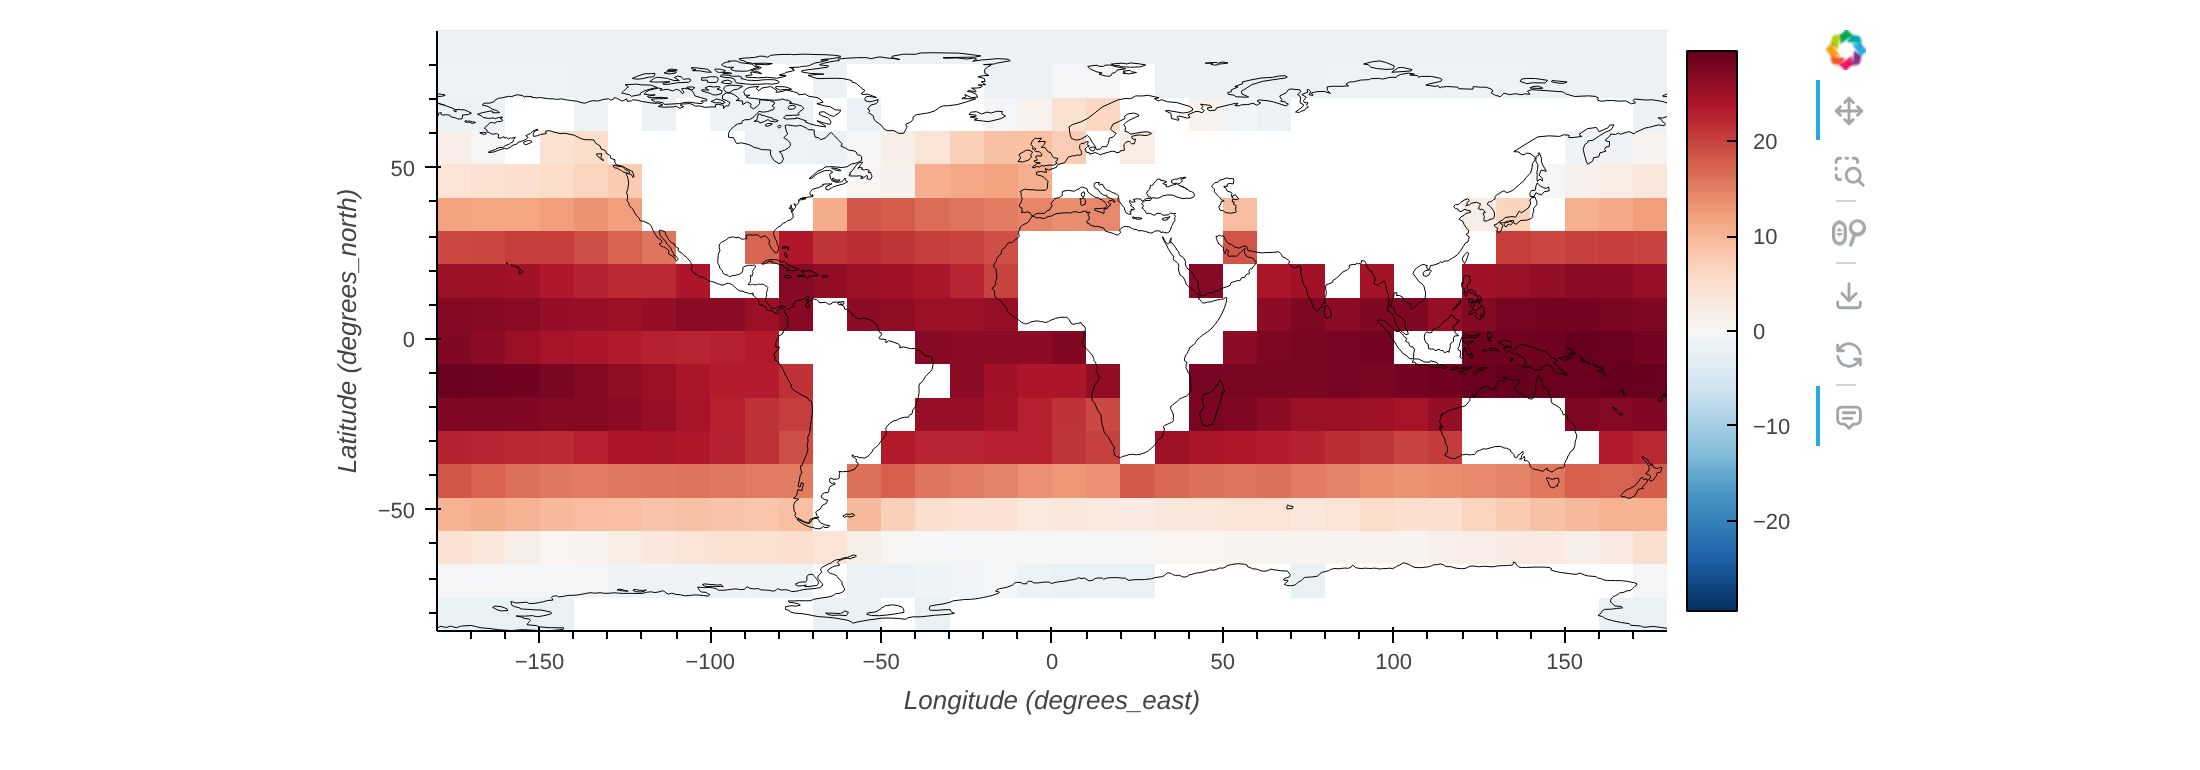
resample_grid makes data spatially coarser — here, keeping only every 10th cell of a 1°×1° dataset turns it into a 10°×10° one:
ds = nc.open_thredds("https://psl.noaa.gov/thredds/dodsC/Datasets/COBE2/sst.mon.mean.nc")
ds.subset(timestep=0)
ds.resample_grid(10)
ds.plot()
fill_na replaces missing values with a distance-weighted average of nearby cells:
ds = nc.open_thredds("https://psl.noaa.gov/thredds/dodsC/Datasets/COBE2/sst.mon.mean.nc")
ds.subset(timestep=0)
ds.fill_na(1)   # distance-weighted infill using 1 nearest neighbour
ds.plot()