Basic arithmetic and logical comparisons can be carried out using the standard Python operators: +, -, *, /, >, <, >=, <=, == and !=.
Illustrated using monthly sea surface temperature from 1850 to the present. The first time step, in Celsius:
ds = nc.open_thredds("https://psl.noaa.gov/thredds/dodsC/Datasets/COBE2/sst.mon.mean.nc")
ds.subset(timestep=0)
ds.plot()

Converting to Kelvin is as simple as adding a constant:
ds + 273.15
ds.plot()

The same works between two datasets. Here, working out how much warmer the 2010s were than the 1910s:
ds_2010s = nc.open_thredds("https://psl.noaa.gov/thredds/dodsC/Datasets/COBE2/sst.mon.mean.nc")
ds_2010s.subset(years=range(2010, 2020))
ds_2010s.tmean()

ds_1910s = nc.open_thredds("https://psl.noaa.gov/thredds/dodsC/Datasets/COBE2/sst.mon.mean.nc")
ds_1910s.subset(years=range(1910, 1920))
ds_1910s.tmean()

ds_2010s - ds_1910s
ds_2010s.plot()

NCToolkit can figure out what it's subtracting from what, even when the two datasets have different temporal resolution. For example, to work out how much warmer or colder each month is than its long-term average, calculate the mean monthly climatology first:
ds = nc.open_thredds("https://psl.noaa.gov/thredds/dodsC/Datasets/COBE2/sst.mon.mean.nc")

climatology = ds.copy()
climatology.tmean("month")   # mean monthly climatology, 12 time steps

ds - climatology              # NCToolkit reports it's subtracting a monthly time series
ds.spatial_mean()
ds.plot()
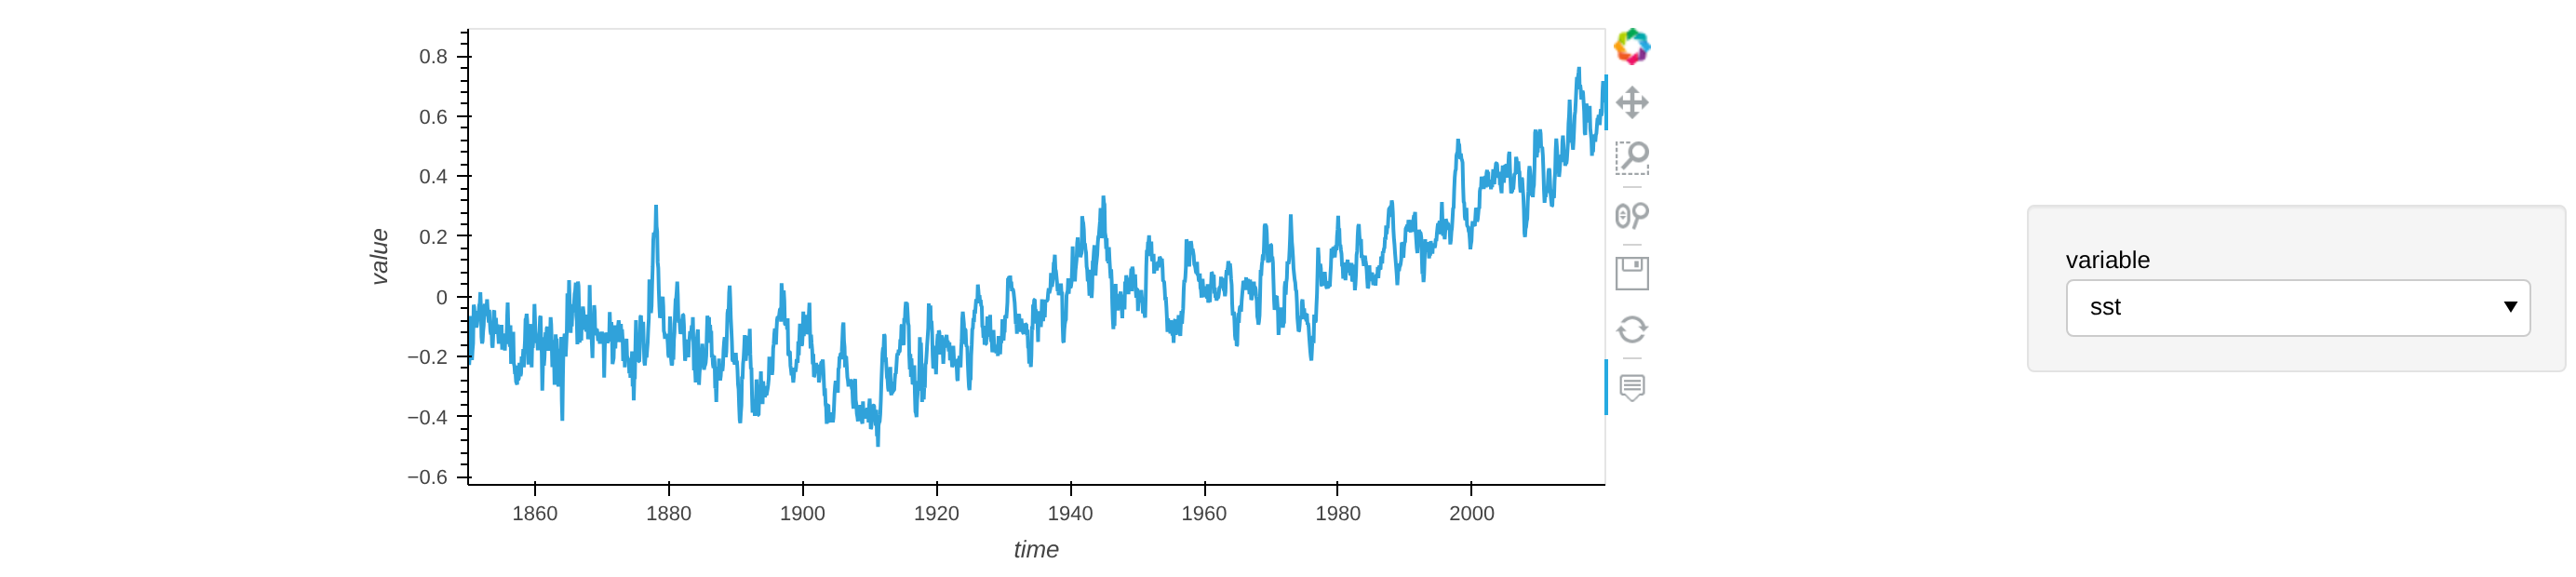
NCToolkit tells you which alignment it inferred. Subtracting an annual climatology instead gives a different message, since NCToolkit recognizes it as annual rather than monthly data:
climatology = ds.copy()
climatology.tmean("year")   # annual mean instead of monthly

ds - climatology              # NCToolkit reports it's subtracting an annual time series
The datasets must otherwise be consistent: subtracting an annual mean with a missing year, for example, from a monthly series that includes it, will raise an error rather than guess.
So the following are equivalent:
ds + 273.15
ds.add(273.15)
At present, +, -, / and * can only automatically handle monthly or annual data on the right-hand side of the operator. Support for subtracting a daily climatology from a multi-year daily series is planned.
Logical comparisons follow the same pattern, with the dataset on the left and a constant or compatible dataset on the right: >, <, ==, >=, <=, !=.
ds = nc.open_thredds("https://psl.noaa.gov/thredds/dodsC/Datasets/COBE2/sst.mon.mean.nc")
ds.subset(timestep=0)
ds > 10                 # where temperature exceeds 10C
ds.plot()

The same works between two datasets — where the 2010s were warmer than the 1910s:
ds_2010s = nc.open_thredds("https://psl.noaa.gov/thredds/dodsC/Datasets/COBE2/sst.mon.mean.nc")
ds_2010s.subset(years=range(2010, 2020))
ds_2010s.tmean()

ds_1910s = nc.open_thredds("https://psl.noaa.gov/thredds/dodsC/Datasets/COBE2/sst.mon.mean.nc")
ds_1910s.subset(years=range(1910, 1920))
ds_1910s.tmean()

ds_2010s > ds_1910s      # where the 2010s were warmer than the 1910s
ds_2010s.plot()

Combined with spatial_mean, this is an easy way to calculate the fraction of the ocean meeting a condition — for the warming example above, over 95% of the world's oceans were warmer in the 2010s than the 1910s.